|
Twin Gear Juicer Yield Comparisons
Aims
This is an attempt to produce an experimental comparison of
the output of two commercial "twin-gear" fruit and vegetable
juicers: the "Twin Health" and "Samson Ultra" machines.
Test equipment
The Samson Ultra model tested was about two years old. The
Twin Health machine was a reveiw sample - with little
visible wear on it.
The tests were made over a ten-day period.
Methodology
Input produce, output fibre, and output juice were all
measured using highly accurate electronic scales. "Lost
material" left inside the juicer was calculated by
subtracting the final output figures from the input ones.
Times given record the time to the last piece of prodcue was
fed into the machine. At the end of this time, the machines
were left running for 30 seconds before the outputs were
weighed.
Times given record the time to the last piece of prodcue was
fed into the machine. At the end of this time, the machines
were left running for 30 seconds before the outputs were
weighed. The machines were fed at a rate that seemed
appropriate.
Jams were recorded. After a jam, the machine was dismantled,
cleaned, and the test was resumed with any remaining produce.
Mainly because the machines had radically different sized
gears, I measured juice output and fibre output and calculated
how much produce remained stuck in the machine at the end
of each run.
These figures were used to calclate a "juicing rate" - that
factored out the "initial loss" that arose during the early
stages of each run.
To determine if the "lost" material was still accumulating
over the course of the run, I divided the produce in many of
the runs in half - and measured the output half way through
the run.
Results
Executive summary
In my tests, the Samson Ultra produced slightly
more juice than the Twin Health machine:
| Machine |
Total Juice/Kg |
| Twin Health
| 8.359 |
| Samson Ultra
| 8.686 |
A more detailed breakdown shows some variation based on product type:
[Here, the "Twin Health" figures were
divided by the "Samson Ultra" ones. Figures bigger than
1.00 are good for the Twin Health machine]
| Produce type |
Total juice |
| Wheatgrass
| 0.77 |
| Collard greens
| 1.00 |
| Celery
| 1.04 |
| Rhubarb
| 0.89 |
| Sprouting broccoli
| 0.85 |
| Cabbage
| 1.01 |
| Beetroot
| 0.89 |
| Carrots
| 1.03 |
| Sweet potatoes
| 0.90 |
| Red grapes
| 1.06 |
| Strawberries
| 0.80 |
| Grapefruit (peeled)
| 0.82 |
| Melon (gala)
| 0.97 |
| Melon (honeydew)
| 0.97 |
| Apples (GS)
| 0.90 |
| Oranges
| 0.83 |
| Pineapple
| 1.07 |
Brief interpretation:
Figures for juice extraction for the two machines are
broadly similar - both machines are reasonably competent at
extracting juice from produce.
To summarise the differences:
- Juice quanity
- Overall, the Samson Ultra machine extracted 4% more
juice from all the combined produce. It produced a
bit more juice the majority of the tests.
- Juice quality
- Initial loss
- "Initial loss" is a measure of how much produce is lost
inside the machine - without being output as juice or fibre.
This can be a relevant factor when juicing relatively small
volumes of material.
Fibre left inside the machine isn't necessarily
undesirable - it's only unextracted juice that might be a
cause for concern.
The Twin Health machine usually had a larger "initial loss"
of produce - a fact I attribute primarily more produce being
lost in its larger gears.
The Samson Ultra experienced greater initial loss
sometimes - typically in cases where the output was
sticky and accumulated around the outside of the screens.
- Eventual juicing rate
- The "eventual juicing rate" is an attempt to measure
efficiency when juicing large volumes of produce.
The idea is to produce a figure for the rate of output once
the machine has been left running long enough to reach a
steady state).
Ideally, this should be determined by running some large-
scale tests - but since I had collected some relevant data
I was able to make an estimate of this.
Overall, the Twin Health machine appeared to exhibit a
slightly greater efficiency in its eventual rate of juicing
green vegetables - but seemed slightly less efficient at
juicing fruit.
Twin Health vs Samson Ultra
"Initial loss"
- This estimates how much produce remains in the juicer.
These figures in this column are derived from data which is
a bit noisy. Figures bigger than 1.0 could be undesirable for
the Twin Health machine.
[Here, the "Twin Health" figures were
divided by the "Samson Ultra" ones. Figures bigger than
1.00 are undesirable for the Twin Health machine]
| Produce type |
Initial loss |
| Wheatgrass
| 1.67 |
| Collard greens
| 7.35 |
| Celery
| 1.22 |
| Rhubarb
| 3.17 |
| Sprouting broccoli
| 7.58 |
| Cabbage
| 1.57 |
| Beetroot
| 2.03 |
| Carrots
| 2.26 |
| Sweet potatoes
| 2.63 |
| Red grapes
| 0.37 |
| Strawberries
| 2.78 |
| Grapefruit (peeled)
| 1.67 |
| Melon (gala)
| 1.59 |
| Melon (honeydew)
| 0.76 |
| Apples (GS)
| 3.08 |
| Oranges
| 1.94 |
| Pineapple
| 1.29 |
Juicing rate
- ...is an attempt to measure of the rate of juice
extraction once the machine has been juicing produce for a
while. This figure is the relevant one if a lot of produce
is likely to be juiced. Figures bigger than 1.00 are
good for the Twin Health machine.
[Here, the "Twin Health" figures were
divided by the "Samson Ultra" ones. Figures bigger than
1.00 are undesirable for the Twin Health machine]
| Produce type |
Juicing rate |
| Wheatgrass
| 0.93 |
| Collard greens
| 1.04 |
| Celery
| 1.08 |
| Rhubarb
| 1.10 |
| Sprouting broccoli
| 1.14 |
| Cabbage
| 1.04 |
| Beetroot
| 0.97 |
| Carrots
| 1.10 |
| Sweet potatoes
| 1.00 |
| Red grapes
| 0.99 |
| Strawberries
| 0.96 |
| Grapefruit (peeled)
| 0.93 |
| Melon (gala)
| 1.06 |
| Melon (honeydew)
| 0.96 |
| Apples (GS)
| 0.99 |
| Oranges
| 0.94 |
| Pineapple
| 1.11 |
Here is a more detailed table - from which the above
summaries were largely derived:
The percentage figures here represent the proportion of the
input mass which was ejected as juice.
The "Total juice yield" column gives the figures for the
test produce I used - while the "Juicing rate" column is the
result of factoring out the "inital loss" - giving a crude
estimate of the expected output of the machines if they are
fed very large volumes of produce.
| Produce type |
Juicing rate |
Total juice yield |
| Produce type |
Twin Health |
Samson Ultra |
Twin Health |
Samson Ultra |
| Wheatgrass
| 92% |
99% |
60% |
78% |
| Collard greens
| 74% |
71% |
64% |
64% |
| Celery
| 92% |
85% |
79% |
76% |
| Rhubarb
| 98% |
89% |
73% |
82% |
| Sprouting broccoli
| 80% |
70% |
58% |
68% |
| Cabbage
| 78% |
75% |
73% |
72% |
| Beetroot
| 61% |
63% |
51% |
57% |
| Carrots
| 66% |
60% |
60% |
58% |
| Sweet potatoes
| 50% |
50% |
43% |
48% |
| Red grapes
| 95% |
96% |
86% |
81% |
| Strawberries
| 92% |
96% |
70% |
87% |
| Grapefruit (peeled)
| 80% |
86% |
58% |
71% |
| Melon (gala)
| 94% |
89% |
76% |
78% |
| Melon (honeydew)
| 82% |
85% |
75% |
76% |
| Apples (GS)
| 85% |
86% |
73% |
81% |
| Oranges
| 77% |
82% |
60% |
72% |
| Pineapple
| 92% |
83% |
76% |
71% |
Raw test data
These tables intended mostly for reference purposes - but
see the appended notes.
Twin Health juicer yields
| Produce |
Screen |
Total |
OK? |
T/s |
Juice |
Fibre |
Lost |
T/s |
Juice |
Fibre |
Lost |
F |
| Wheatgrass
| Fine
| 0.116 |
Y |
- |
- |
- |
- |
160 |
0.070 |
0.006 |
0.040 |
0 |
| Collard greens
| Fine
| 0.472 |
Y |
- |
- |
- |
- |
580 |
0.304 |
0.109 |
0.059 |
1 |
| Celery
| Fine
| 0.257 |
Y |
25 |
0.075 |
0.004 |
0.049 |
50 |
0.193 |
0.007 |
0.057 |
- |
| Celery
| Fine
| 0.570 |
Y |
88 |
0.210 |
0.020 |
0.055 |
180 |
0.462 |
0.048 |
0.060 |
- |
| Rhubarb
| Fine
| 0.690 |
N |
72 |
0.259 |
0.006 |
0.080 |
n/a |
0.507 |
0.012 |
0.171 |
- |
| Sprouting broccoli
| Fine
| 0.330 |
N |
121 |
0.087 |
0.020 |
0.058 |
n/a |
0.193 |
0.046 |
0.091 |
9 |
| Cabbage
| Fine
| 1.000 |
Y |
240 |
0.344 |
0.096 |
0.060 |
538 |
0.728 |
0.206 |
0.066 |
8 |
| Beetroot
| Coarse
| 0.334 |
Y |
75 |
0.075 |
0.047 |
0.045 |
154 |
0.171 |
0.108 |
0.055 |
- |
| Carrots
| Fine
| 0.500 |
Y |
67 |
0.132 |
0.070 |
0.048 |
147 |
0.299 |
0.151 |
0.050 |
- |
| Carrots
| Fine
| 0.750 |
Y |
99 |
0.215 |
0.108 |
0.052 |
199 |
0.452 |
0.239 |
0.059 |
- |
| Sweet potatoes
| Fine
| 0.360 |
Y |
- |
- |
- |
- |
140 |
0.155 |
0.155 |
0.050 |
1 |
| Red grapes
| Medium
| 0.600 |
Y |
90 |
0.250 |
0.020 |
0.030 |
170 |
0.538 |
0.026 |
0.036 |
- |
| Red grapes
| Medium
| 0.500 |
Y |
57 |
0.191 |
0.007 |
0.052 |
121 |
0.409 |
0.028 |
0.063 |
1 |
| Strawberries
| Coarse
| 0.796 |
Y |
91 |
0.240 |
0.021 |
0.137 |
179 |
0.556 |
0.051 |
0.189 |
- |
| Grapefruit (peeled)
| Coarse
| 0.500 |
Y |
34 |
0.137 |
0.020 |
0.093 |
85 |
0.290 |
0.071 |
0.139 |
0 |
| Melon (gala)
| Coarse
| 0.680 |
Y |
105 |
0.250 |
0.013 |
0.077 |
156 |
0.520 |
0.034 |
0.126 |
1 |
| Melon (honeydew)
| Medium
| 1.000 |
Y |
128 |
0.369 |
0.055 |
0.076 |
243 |
0.764 |
0.136 |
0.100 |
2 |
| Melon (honeydew)
| Medium
| 0.822 |
Y |
- |
- |
- |
- |
201 |
0.603 |
0.101 |
0.118 |
1 |
| Apples (GS)
| Medium
| 0.444 |
Y |
71 |
0.145 |
0.020 |
0.057 |
143 |
0.325 |
0.058 |
0.061 |
12 |
| Oranges
| Medium
| 0.430 |
Y |
30 |
0.121 |
0.018 |
0.076 |
65 |
0.262 |
0.077 |
0.091 |
0 |
| Pineapple
| Coarse
| 0.736 |
Y |
- |
- |
- |
- |
185 |
0.558 |
0.046 |
0.132 |
1 |
| Totals
|
| |
|
|
|
|
|
4082 |
8.359 |
|
1.704 |
37 |
Samson Ultra juicer yields
| Produce |
Screen |
Total |
OK? |
T/s |
Juice |
Fibre |
Lost |
T/s |
Juice |
Fibre |
Lost |
F |
| Wheatgrass
| Fine
| 0.116 |
Y |
- |
- |
- |
- |
151 |
0.091 |
0.001 |
0.024 |
6 |
| Collard greens
| Fine
| 0.472 |
Y |
- |
- |
- |
- |
330 |
0.301 |
0.163 |
0.008 |
17 |
| Celery
| Fine
| 0.257 |
Y |
26 |
0.076 |
0.019 |
0.033 |
51 |
0.180 |
0.036 |
0.041 |
- |
| Celery
| Fine
| 0.570 |
Y |
65 |
0.230 |
0.031 |
0.024 |
132 |
0.449 |
0.072 |
0.049 |
- |
| Rhubarb
| Fine
| 0.690 |
Y |
62 |
0.309 |
0.034 |
0.002 |
127 |
0.568 |
0.068 |
0.054 |
- |
| Sprouting Broccoli
| Fine
| 0.330 |
Y |
70 |
0.101 |
0.040 |
0.024 |
210 |
0.225 |
0.093 |
0.012 |
18 |
| Cabbage
| Fine
| 1.000 |
Y |
291 |
0.348 |
0.121 |
0.031 |
571 |
0.715 |
0.243 |
0.042 |
13 |
| Beetroot
| Fine
| 0.334 |
Y |
58 |
0.085 |
0.059 |
0.023 |
148 |
0.192 |
0.115 |
0.027 |
- |
| Carrots
| Fine
| 0.500 |
Y |
150 |
0.140 |
0.070 |
0.040 |
230 |
0.296 |
0.167 |
0.037 |
- |
| Carrots
| Fine
| 0.750 |
Y |
110 |
0.192 |
0.156 |
0.027 |
210 |
0.428 |
0.296 |
0.026 |
- |
| Sweet potatoes
| Fine
| 0.360 |
Y |
- |
- |
- |
- |
143 |
0.172 |
0.169 |
0.019 |
3 |
| Red grapes
| Coarse
| 0.600 |
Y |
45 |
0.222 |
0.008 |
0.070 |
91 |
0.483 |
0.020 |
0.097 |
- |
| Red grapes
| Coarse
| 0.500 |
Y |
59 |
0.192 |
0.005 |
0.053 |
120 |
0.404 |
0.017 |
0.079 |
1 |
| Strawberries
| Coarse
| 0.796 |
Y |
85 |
0.326 |
0.012 |
0.060 |
165 |
0.698 |
0.030 |
0.068 |
- |
| Grapefruit (peeled)
| Coarse
| 0.500 |
Y |
41 |
0.171 |
0.023 |
0.056 |
86 |
0.358 |
0.059 |
0.083 |
0 |
| Melon (gala)
| Coarse
| 0.680 |
Y |
105 |
0.251 |
0.034 |
0.055 |
154 |
0.532 |
0.069 |
0.079 |
1 |
| Melon (honeydew)
| Coarse
| 1.000 |
Y |
119 |
0.374 |
0.059 |
0.067 |
235 |
0.775 |
0.093 |
0.132 |
1 |
| Melon (honeydew)
| Coarse
| 0.822 |
Y |
- |
- |
- |
- |
180 |
0.619 |
0.085 |
0.118 |
1 |
| Apples (GS)
| Coarse
| 0.444 |
Y |
51 |
0.182 |
0.020 |
0.020 |
100 |
0.361 |
0.058 |
0.025 |
10 |
| Oranges
| Coarse
| 0.430 |
Y |
31 |
0.143 |
0.030 |
0.042 |
65 |
0.313 |
0.070 |
0.047 |
0 |
| Pineapple
| Coarse
| 0.736 |
Y |
- |
- |
- |
- |
125 |
0.526 |
0.108 |
0.102 |
4 |
| Totals
|
| |
|
|
|
|
|
3624 |
8.686 |
|
1.169 |
75 |
Notes about the data:
- Regrettably, the wheatgrass test used a
relatively small volume of material. As a result,
little fibre was output by the end of the test - and the
"initial loss" figures for this test are practically
worthless.
- I used a coarse screen in the Twin Health beetroot test
by mistake. The results were included anyway.
- The Twin Health machine jammed twice during the testing.
In the case of the rhubarb test, the machine failed to
output any fibre. The fibre accumulated inside the machine
until it jammed solid - and not even reverse gear would
work. In the case of the purple sprouting broccoli the
cause of the jam was feeding in a particularly thick piece
of stem. While such jams are not encouraging, I do not
think they are very significant to normal usage - and would
not recommend avoiding the Twin Health machine on the
grounds that it's more likely to jam up.
- Grapefruits, oranges and pineapples were the only things
that were peeled before juicing.
- Produce was chopped into small peices before the tests started.
- The last column "F" (sometimes) records the volume of foam
produced.
Twin Health juice screen comparison
This was a test to look at the difference between the two
"Twin Health" juice screens.
The screens had different sized holes - and different strength
pressure regulators.
The tentative conclusion was that effect (on juice yield) of
the larger holes was roughly cancelled out by the reduced
pressure regulation - at least in the case of these apples.
| Produce |
Screen |
Total |
T/s |
Juice |
Fibre |
Lost |
T/s |
Juice |
Fibre |
Lost |
F |
| Apples (GS)
| Medium
| 0.444 |
71 |
0.145 |
0.020 |
0.057 |
143 |
0.325 |
0.058 |
0.061 |
12 |
| Apples (GS)
| Coarse
| 0.444 |
82 |
0.155 |
0.012 |
0.055 |
132 |
0.322 |
0.045 |
0.077 |
8 |
On the significance of juice yields
How important is juice yield?
Produce is not that expensive - is it possible to make up
for low yields by simply pressing a little extra produce?
Maybe - but maybe not.
The argument has been made that the easiest juice to extract is of the
worst quality - and that the very last bit of the juice that can be
pressed from produce is the most laden with nutrients.
Naturally this argument is made my the manufacturers of the
most efficient and expensive equipment - and by those who
advocate the use of blenders.
It appears to be generally true that certain nutrients tend
to be more strongly bound to the fibre - and that discarding
the fibre alters the micronutrients which are present in the
produce.
Simple-minded models where the produce consists of a variety
of structures (e.g. pulp, skin and seeds) which require
different thresholds of force to disrupt them would suggest
that the last bit of juice extracted from produce may well
contain a different set of nutrients from the first bits of
juice extracted.
That seeds and skin often contain interesting phytonutrients
- and are also harder to crush - supports the idea that the
last bit of juice wrung from produce may well be the best
quality.
So - though I am not aware of any proper scientific
investigation of the issue - my opinion is that the idea
that squeezing produce well may a bit be superior to
squeezing more produce less efficiently may well have
something to it - though I don't feel I am in a position to
offer much useful advice about how heavily the issue should
be weighted.
Figures cited in "Twin Health" publicity materials
| Produce type |
Mass |
Twin Health |
Samson Ultra |
| Granny Smiths | 1kg | 780ml | 700ml |
| Celery | 1kg | 850ml | 710ml |
| Spinach | 1kg | 730ml | 695ml |
| Beetroot | 1kg | 670ml | 610ml |
| Red Grapes | 1kg | 860ml | 700ml |
The "Twin Health" publicity materials claim:
The above chart is an extract from an extensive juice study
conducted in May 2003, to measure the actual output of juice
excluding any foam content. The figures shown are the
averages of 9 x 1kg test samples of the same produce for
each machine, and took over 500kg of produce and 160 hours
to complete.
[This test can be performed by anyone, and similar results
will be achieved.]
However no reference to the source of these tests was
provided.
Juicing large volumes of produce may give accurate results -
but it glosses over the issue of initial produce loss - and
that is not one of the Twin Health machine's stronger points.
I also got relatively good results from the Twin Health
machine using red grapes - but grapes seemed to be one of
the very few fruit that it could beat the Samson machine
on.
Generally, my test results suggest that the Twin Health
machine typically produces slightly less juice -
except when juicing lots of leafy vegetables.
However, my subjective impression is that the finer screens
available can often mean that the resulting output is of a
better quality.
Why does the Twin Health machine not produce quite
so much juice?
One hypothesis would be that the Samson machine is doing a
poorer job of separating the juice and the fibre - and is
dumping fibre into the juice.
However, my impression is that this isn't the whole story -
the yields were still worse even when (closely comparable in
terms of hole size) coarse screens were used on both
models.
Other possible factors that might explain the difference
include lower pressures, not such close tolerances inside
the machine - and perhaps somewhat greater retention of
unjuiced material inside the machine at the end of the
tests.
If more time had been available, for testing, the hypothesis
of lower pressure being responsible for the somewhat-lower
yields could have been examined - by using greater pressure
restriction with the coarse fruit screen on the Twin Health
machine.
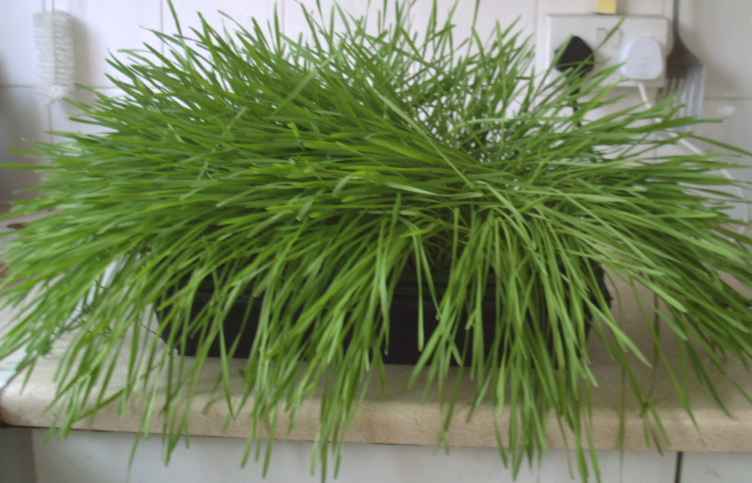
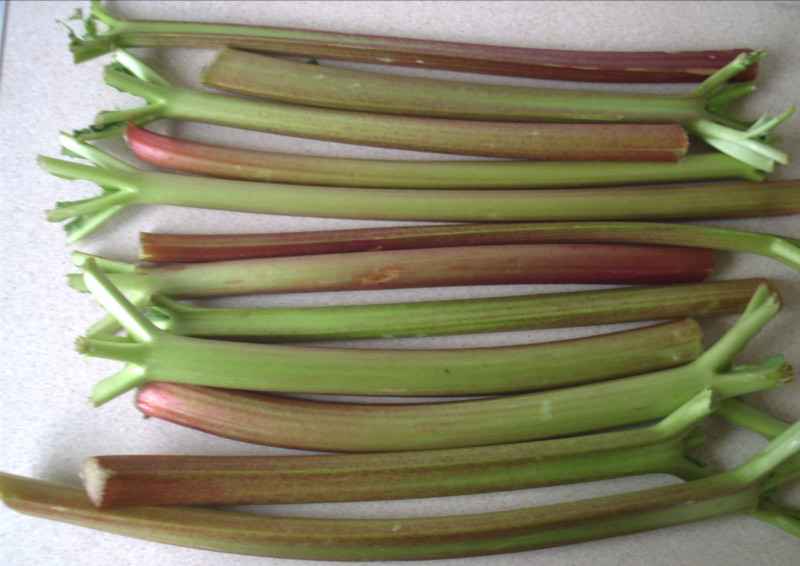
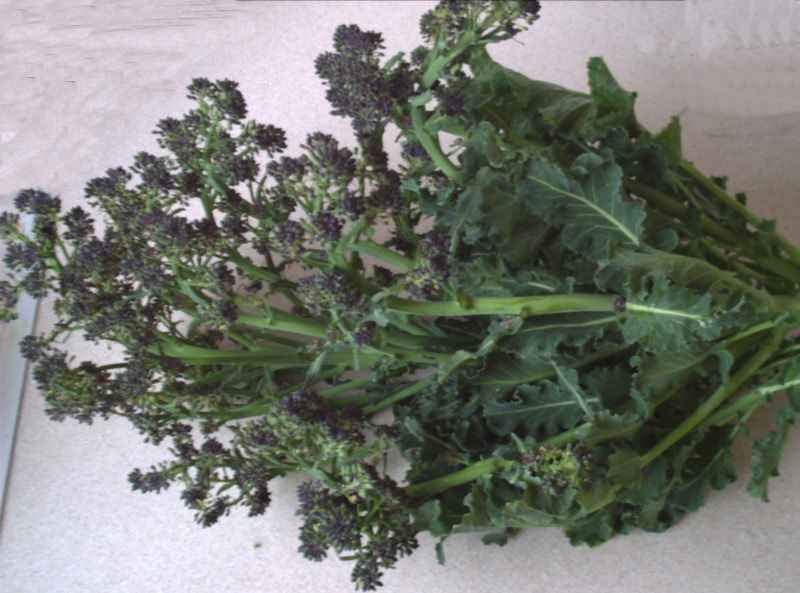
Test loads
Photos of the actual produce used to test with:
Wheatgrass test load
rhubarb test load
Purple sprouting broccoli test load
|